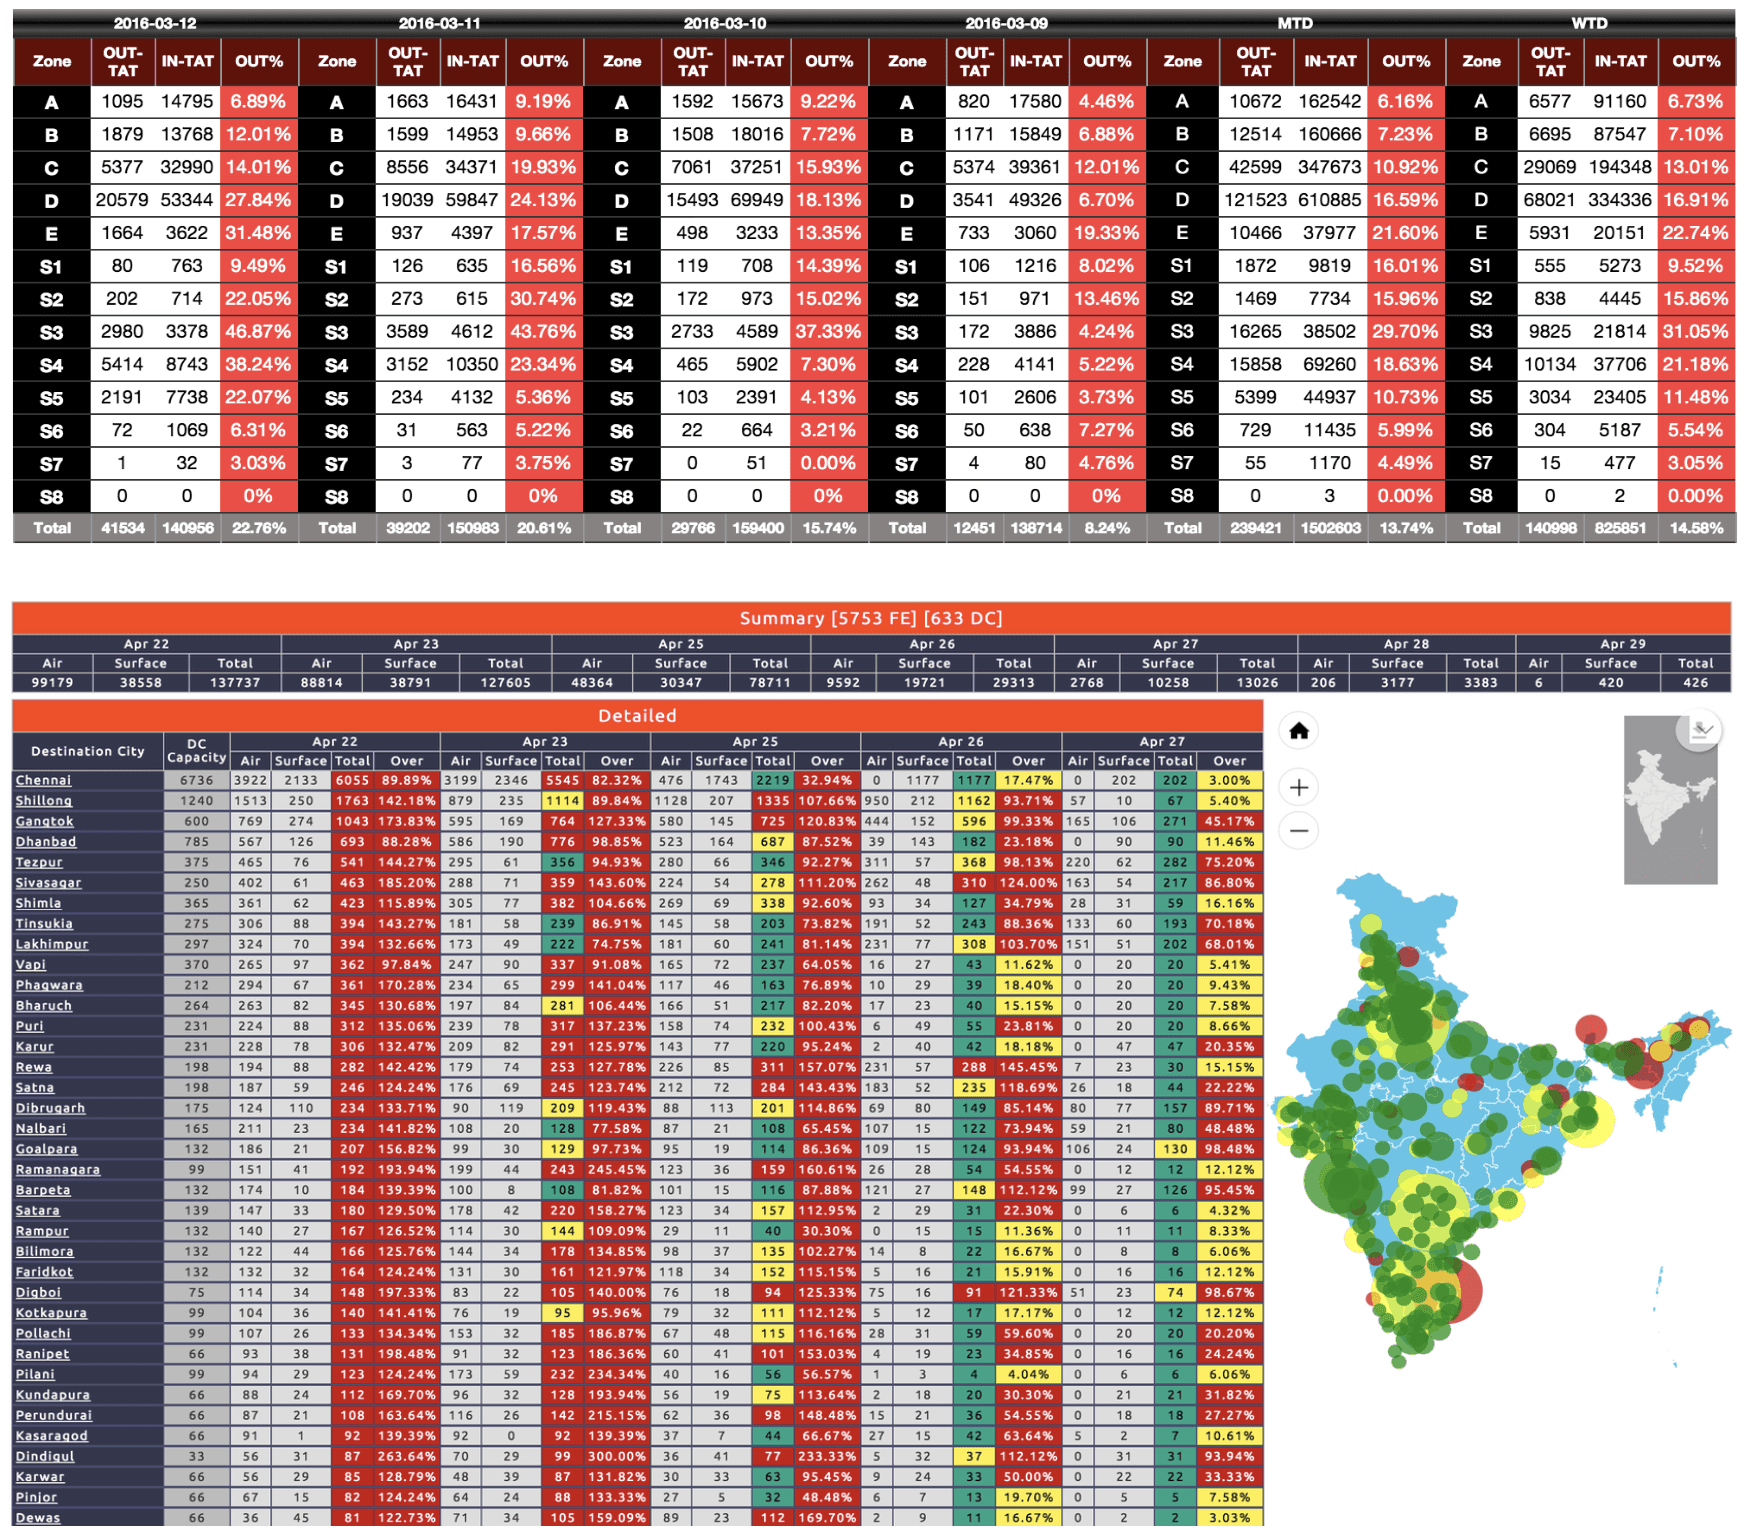
Control Tower: Helping Logistics Teams Act Before Delays Spread
A forecasting dashboard for Delhivery’s response team that turned spreadsheet-based monitoring into a role-based system for spotting network stress and acting before packages were delayed.
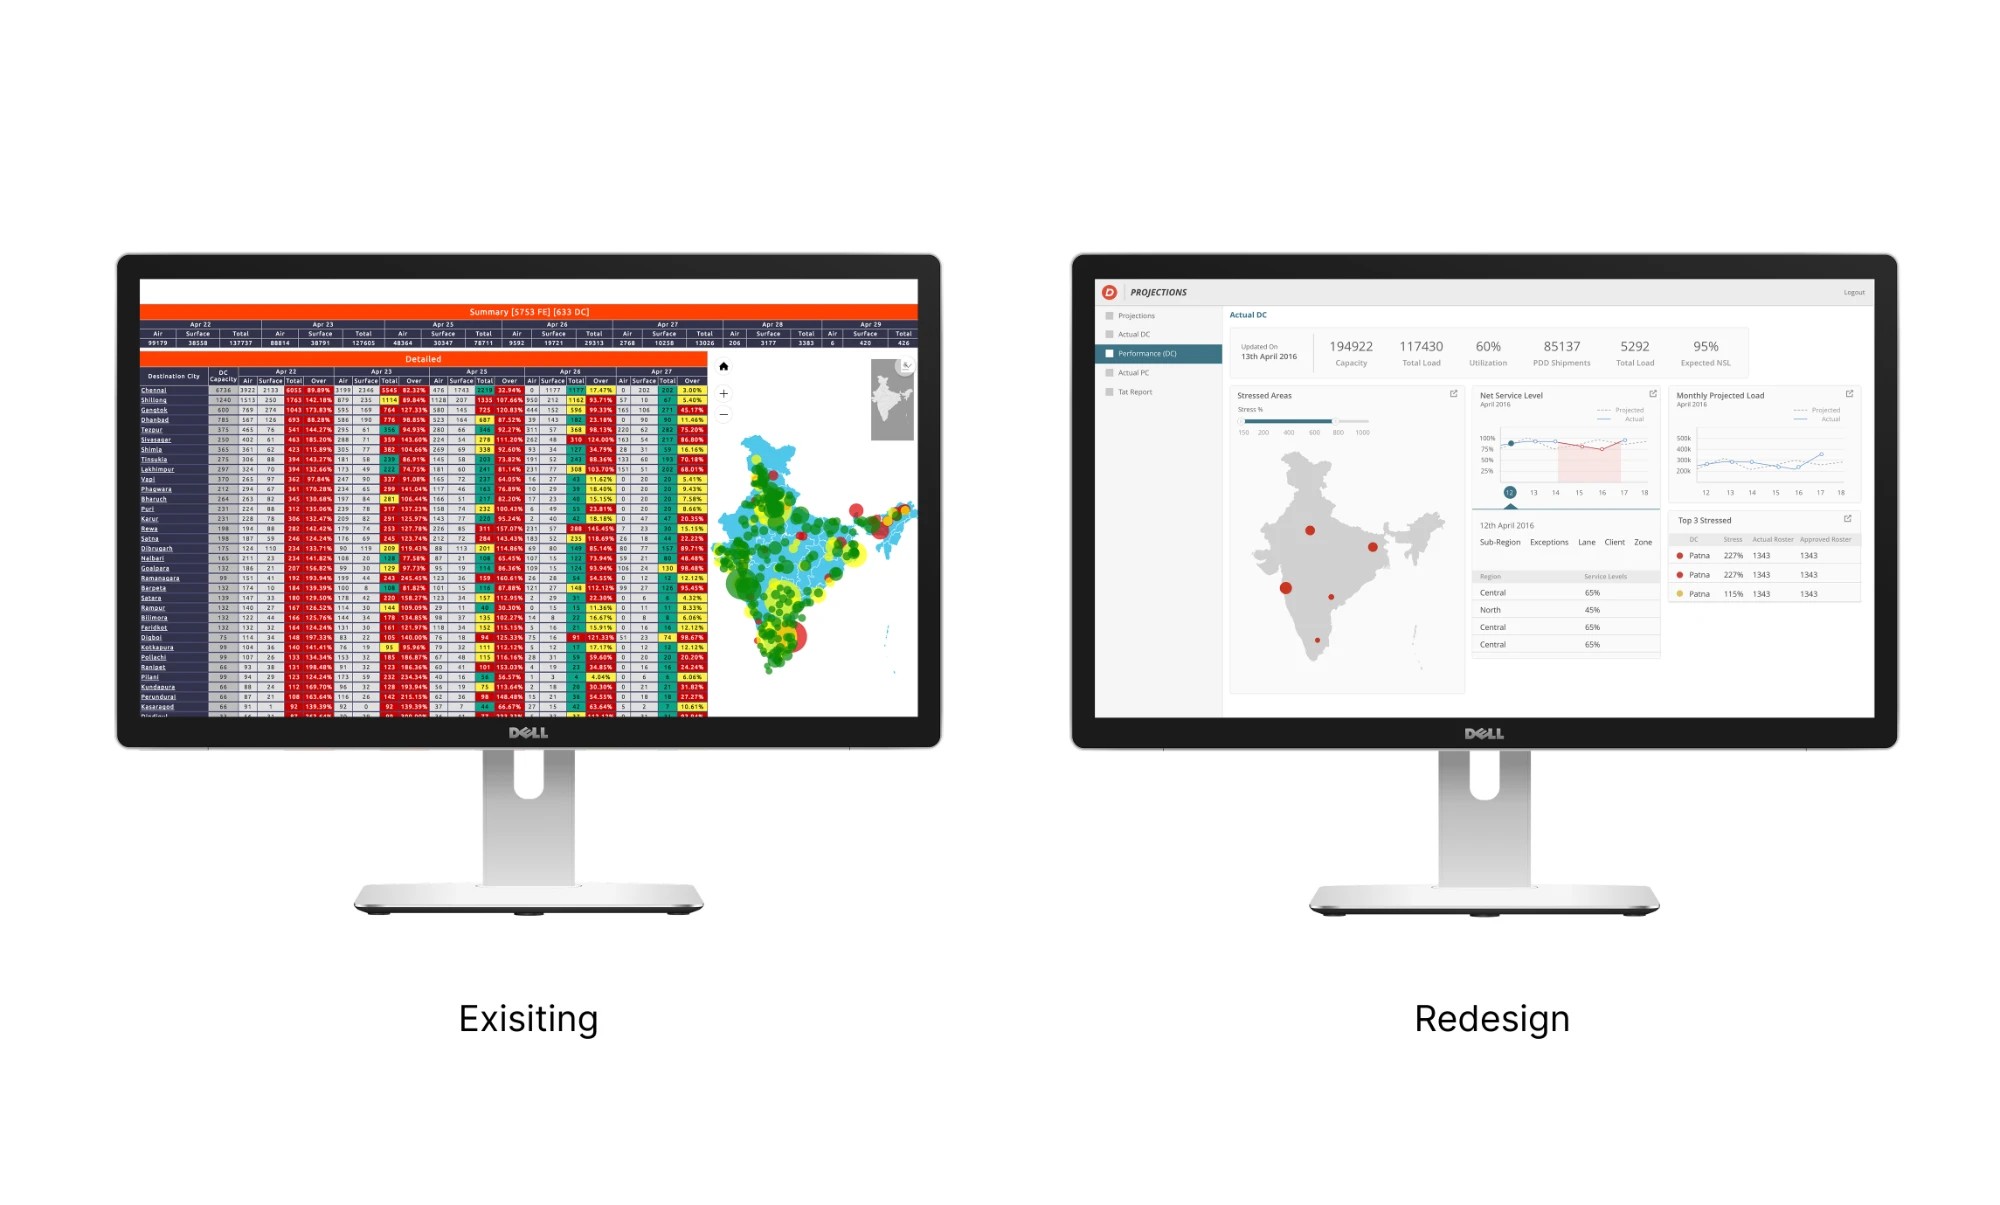
Turn spreadsheet-based monitoring into a role-based dashboard that helps each team spot network stress and act before packages are delayed.
- Create a shared Pan-India view of supply-chain operations
- Identify operational risks and disruptions earlier
- Improve coordination across functions and regions
- Understand network health quickly
- Identify exceptions and disruptions easily
- Know who to coordinate with, and why
- Move from identifying a problem to taking action faster
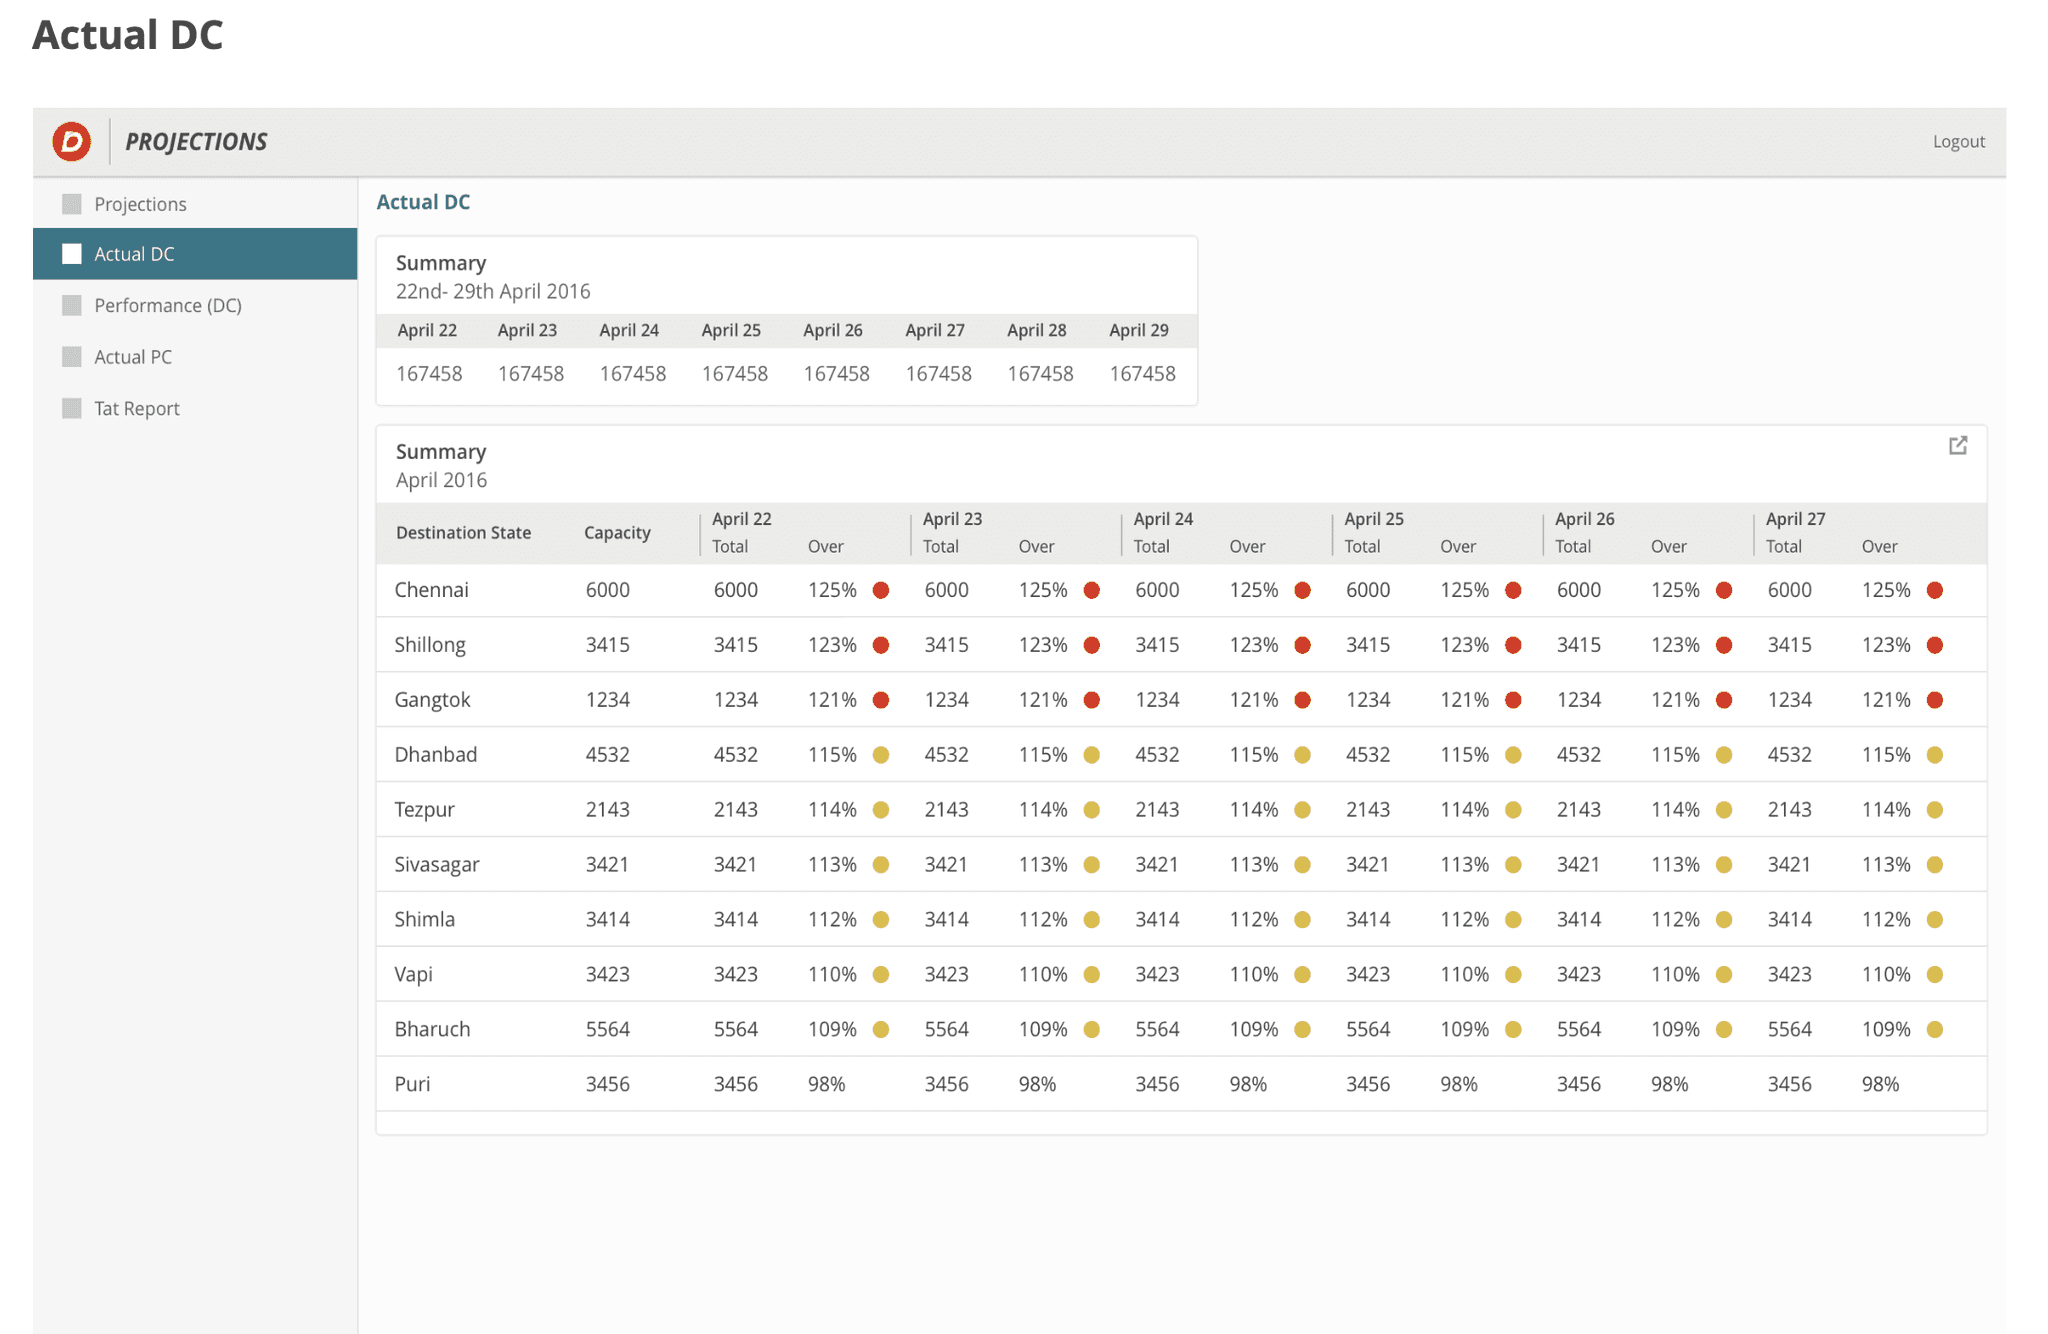
Mapped three user roles to their data and actions, reframed the interface around decisions, and structured four connected views — Projections, Actual DC, Performance DC and a TAT Report — across a three-level hierarchy from overview to diagnosis.
Role: Design Associate — research, information architecture, dashboard UX & UI, with Delhivery’s Control Tower product team.
A role-based operational dashboard that surfaced current stress, future risk and contributing causes — shifting the team from reactive reporting to preventive action.
The spreadsheets treated every figure as equally important. I reframed the interface around the decisions each user actually had to make — what requires attention now, what’s likely to become a problem next, and who needs to act. That single shift moved the system from passive reporting toward preventive operations.